[vc_row][vc_column][vc_column_text]
What rail operators can learn from airports in smoothing journeys
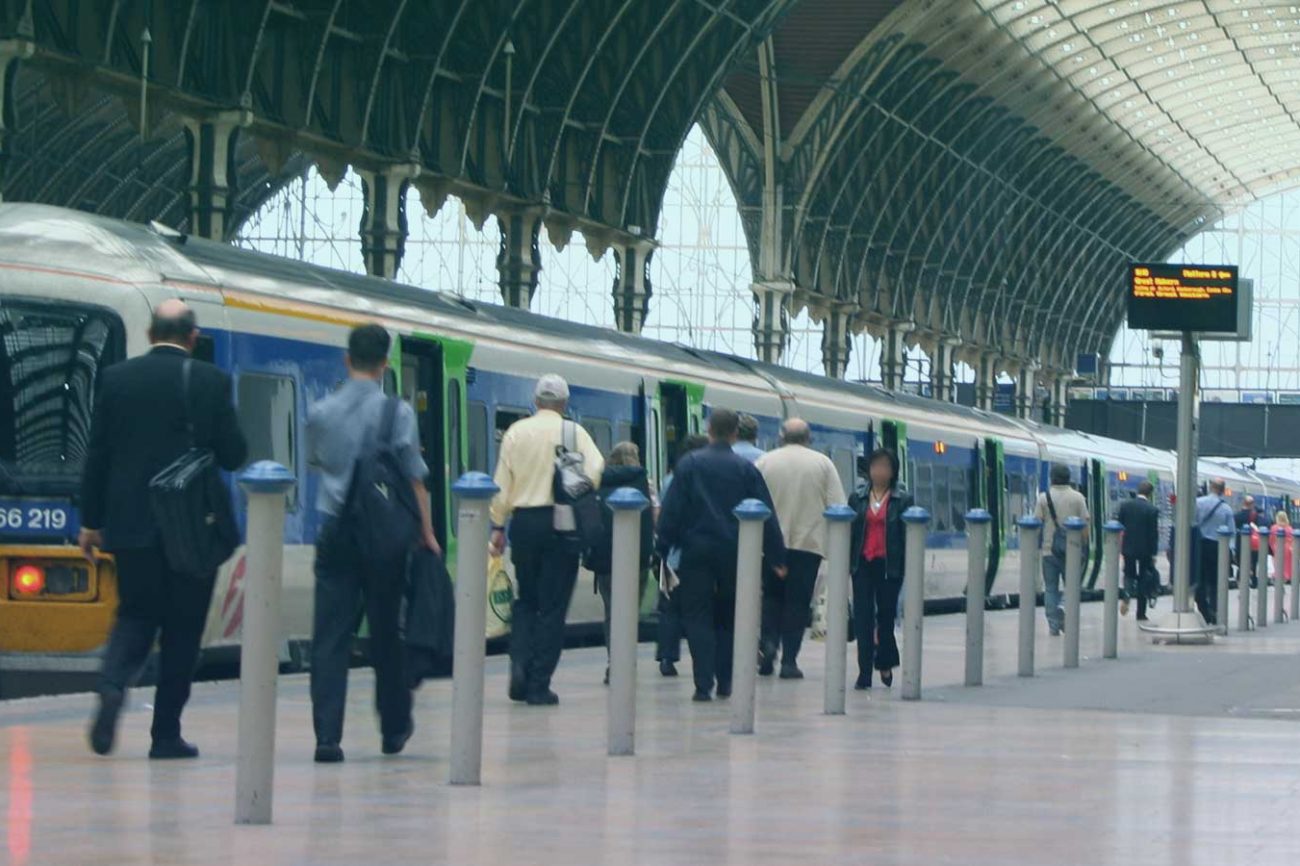
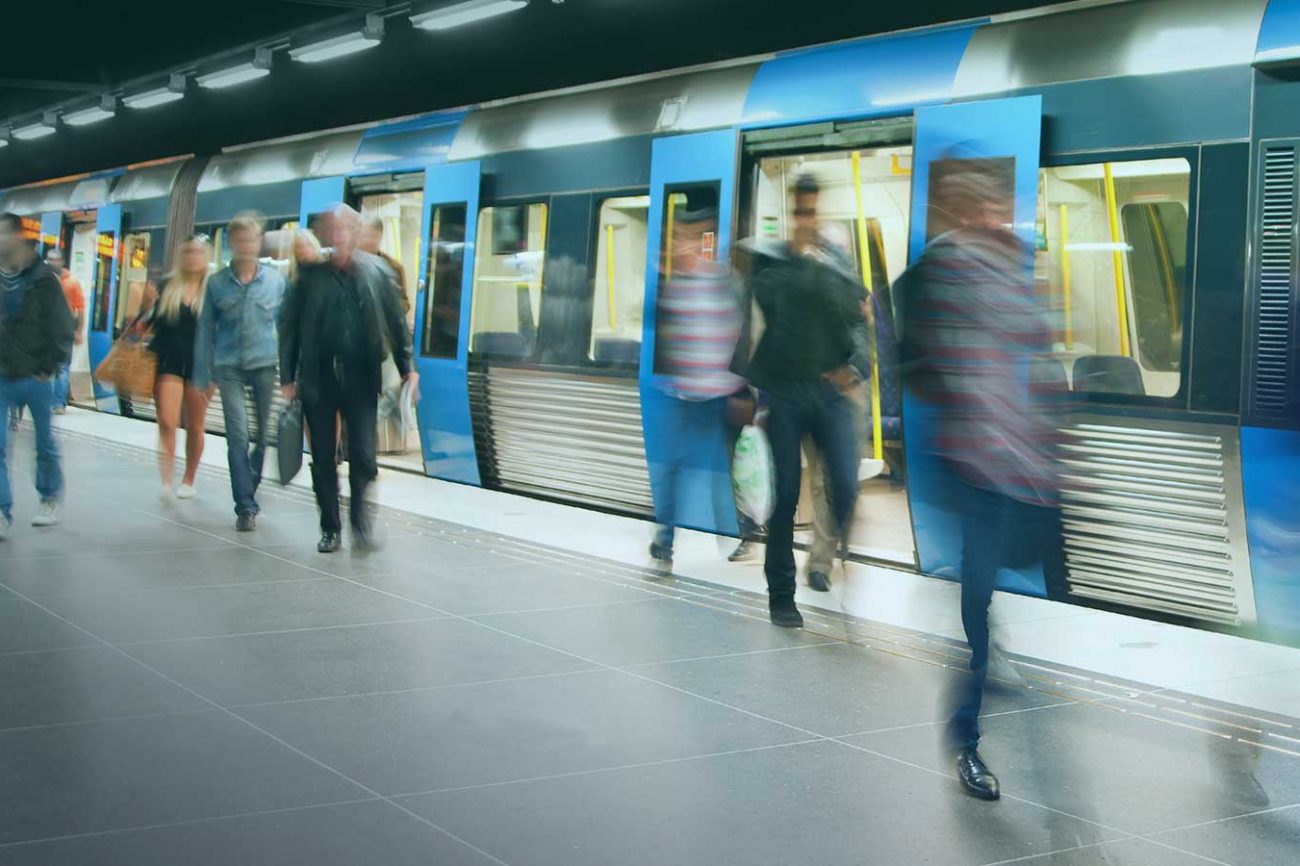
[/vc_column_text][vc_single_image image=”9685″ img_size=”full”][/vc_column][/vc_row][vc_row full_width=”stretch_row” bg_type=”image” parallax_style=”vcpb-default” css=”.vc_custom_1567163833988{background-position: center !important;background-repeat: no-repeat !important;background-size: cover !important;}”][vc_column width=”2/3″][vc_column_text]Travel by city rail or metro has a long history of crowded platforms. Many of these stations are old and built in places where there’s either no room to expand or, if underground, very costly to expand. The networks and stations are today moving a lot more people than they were planned for when designed decades ago. Busy can quickly turn into unsafe with delays in train arrival or departure; sudden influxes of unexpected groups of people, or platform closures due to maintenance works
Left unmanaged, crowds on stairs, escalators and platforms can cause a cycle of service operation issues and quickly turn a busy station into a safety risk hotspot. The more commuters there are, the longer trains have to wait for them to board and alight. The later trains are, as a result, the more crowded, uncomfortable and hazardous platforms become.[/vc_column_text][vc_column_text]
Balancing safety, security and efficiency
We know that positive rider experiences are built on a solid foundation of safety, security and efficiency.
Safety hinges on the ability to prevent crowds before they form. Security relies on having a clear view of potential problems. And efficiency is only achieved when operators have a clear understanding of demand to plan resources and services accurately.
There’s nothing new to this conundrum; it is a challenge that rail operators have been dealing with since the early days. The question is, how can it be solved practically and cost-effectively.
Rail operators aren’t in it alone.
Their travel counterparts, airports, also face irregular operations such as delays, mechanical issues and unexpected passenger behaviour – making decisions in real-time to balance resources with demand, minimise disruption and create positive passenger experiences.
So are there lessons that rail networks can learn from airports, including how to apply proven methodologies and coordinate multiple parties, to control crowding, provide safe travel, and streamline operations?[/vc_column_text][vc_column_text]
Holistic problem solving
Airport Operating Centres (APOC) are the eyes and ears of an airport. Organised as a physical or virtual centre, the APOC connects airport stakeholders – operations management, airlines, handlers, air traffic control, security and police – and provides a transparent picture of what’s happening around the airport.
The full potential of APOC boils down to capturing data and lots of it. Anything that could impact the timely departure of aircraft or the safety of people – crowding, security queues, road traffic delays, air network traffic changes, aircraft mechanical issues, apron congestions, terminal incidents and more.
Some rail networks and stations already run control rooms where they can manage signals, monitor trains and monitor CCTV camera feeds. These centres also allow them to work with emergency services to react quickly to large scale incidents. But simply sharing information doesn’t always result in the best action, especially if its impact is not fully anticipated.
Therein lies the strength of APOCs at airports, such as Schiphol and Brussels: predictive intelligence. These airports not only monitor real-time operational performance, they also apply advanced analytics across a vast range of data to understand what will happen next. This enables airports to get ahead of issues with their partners – allowing for more efficient use of ground crew and resources, improving on-time departures and lifting overall air network performance.[/vc_column_text][vc_column_text]
Mapping journeys start-to-end with real data
Rail and transit operators can take a page of the airport APOC playbook by setting up a similar structure that provides a more holistic and predictive picture of activity across busy stations and the wider network.
By capturing how people move, dwell, and transfer and linking it with scheduling information, operators can more accurately view trends over time– including passenger load per train, busier or quieter times of day or days of the week, and any effects of delays or planned city events.
Importantly, mapping journeys, and not just movement within stations, helps identify travel patterns and pressure points that are not always evident from entry/exit logs or ticketing information.[/vc_column_text][vc_column_text css=”.vc_custom_1647000736042{padding-top: -10px !important;padding-bottom: -20px !important;}”]
Illustrative data examples
[/vc_column_text][vc_row_inner][vc_column_inner width=”1/2″][vc_single_image image=”9686″ img_size=”full” style=”vc_box_shadow” onclick=”img_link_large”][/vc_column_inner][vc_column_inner width=”1/2″][vc_single_image image=”9690″ img_size=”full” style=”vc_box_shadow” onclick=”img_link_large”][/vc_column_inner][/vc_row_inner][vc_column_text]A window of opportunity
Advanced analytics combines these historical patterns with real-time movement data to predict the future, allowing rail operators to anticipate deviations from the normal and understand any expected knock-on effect of disruptions. From unexpected traveller surges, train delays, security issues, breakdowns – proactive actions can be taken to eliminate or at least reduce any impact in both the station and across the network.
For example, in response to anticipated overcrowding, riders could receive dynamic information on journeys. This could be recommendations at street level to use other entrances, messages on platforms on best places to stand and carriage to use. Or proactive suggestions to use alternative routes, diverting passengers from building hot spots.
Likewise, automated turnstiles can control the flow of people into an already busy station, or digital signage could change to optimise flows to one way rather than bi-directional.
Incorporating real-time platform and train occupancy data can also be used for operational decisions and service optimisation, such as minor adjustments to the train release.[/vc_column_text][vc_column_text]
From better safety to better services
As well as tackling operational challenges, airports have also been able to use passenger movement patterns to plan for better services and experiences. Many have increased their revenue and lowered their cost to serve as a result.
For example, by installing people movement sensors in the wider airport precinct, a North American airport now understands what transport options travellers use to get to the airport, identify any barriers to timely arrival and optimise connecting transport planning and parking facilities.
Another European airport was able to clearly understand the routes passengers take through the terminal to the gate and the time spent in each area, including shopping and dwell patterns. With this knowledge, they can better plan food and beverage site locations, including the placement of pop-up stores in high-density dwell areas, and adjust flow patterns to improve experiences and likelihood of increased spend.
By understanding restrooms usage patterns and how it linked to the flight schedule, a European airport moved from rigid bathroom cleaning schedules to demand-based services, resulting in improved cleaning efficiency and cleaner facilities.[/vc_column_text][vc_column_text]
Following the path of airports to smoother journeys
With the right data, advanced analytics and a coordinated, centralised approach to decision making, it is possible for rail operators to reach new levels of efficiency and performance.
From ensuring that crowds are redistributed as they start forming to allocating staff and services in real-time to where they’re needed most, operations can be more efficient, safe and secure – in turn, attracting more riders and investment dollars.
For airports, investing in centralised, data-driven operations centres has taken the front seat in improving performance, minimising disruptions and creating better passenger journeys. There’s nothing stopping rail operators from doing the same.
Need to inject some new thinking into your rail planning? Just look to the sky.[/vc_column_text][vc_separator][vc_column_text]Veovo helps transport hubs globally adapt to new processes and changing travel patterns, unlock efficient ways of working and provide safer journeys. Please get in touch to arrange a call with one of our experts to explore how we can help your business.[/vc_column_text][/vc_column][vc_column width=”1/12″][/vc_column][vc_column width=”1/4″][vc_row_inner gap=”5″ css=”.vc_custom_1590581603841{padding-right: 15px !important;padding-bottom: 30px !important;padding-left: 15px !important;}”][vc_column_inner css=”.vc_custom_1568208991171{margin: 0px !important;border-width: 0px !important;padding: 0px !important;}”][vc_single_image image=”8164″ img_size=”full” alignment=”center” css_animation=”top-to-bottom” el_id=”open-newsletter-popup”][/vc_column_inner][/vc_row_inner]
[vc_widget_sidebar show_bg=”false” sidebar_id=”sidebar_1″][/vc_column][/vc_row][vc_row full_width=”stretch_row” bg_type=”bg_color” bg_override=”full” seperator_enable=”seperator_enable_value” seperator_type=”tilt_right_seperator” seperator_svg_height=”220″ seperator_shape_background=”#ffffff” bg_color_value=”rgba(42,210,201,0.05)” css=”.vc_custom_1591684458820{margin-top: 50px !important;padding-bottom: 30px !important;}”][vc_column][dt_testimonials_carousel dis_posts_total=”10″ content_layout=”layout_1″ content_alignment=”center” content_bg=”n” post_content_paddings=”30px 50px 20px 50px” img_max_width=”120px” img_border_radius=”500px” slides_on_wide_desk=”1″ slides_on_desk=”1″ autoplay=”y” post_title_font_size=”40px” post_title_line_height=”32px” post_title_bottom_margin=”5px” testimonial_position_font_size=”24px” testimonial_position_line_height=”28px” testimonial_position_color=”#2ad2c9″ post_content=”show_content” content_font_size=”17px” content_line_height=”27px” custom_content_color=”#253746″ content_bottom_margin=”0px” arrow_bg_width=”36x” arrow_border_width=”0px” arrow_bg_color=”#2ad2c9″ arrow_bg_color_hover=”#2fa8a1″ r_arrow_icon_paddings=”0px 0px 0px 0px” r_arrow_v_offset=”0px” l_arrow_icon_paddings=”0px 0px 0px 0px” l_arrow_v_offset=”0px” css_dt_testimonials_carousel=”.vc_custom_1646996859924{margin-top: 0px !important;background-position: center !important;background-repeat: no-repeat !important;background-size: contain !important;}” category=”9″][/vc_column][/vc_row][vc_row full_width=”stretch_row” bg_type=”bg_color” bg_color_value=”#2ad2c9″ css=”.vc_custom_1622452569585{margin-bottom: -100px !important;}”][vc_column css=”.vc_custom_1567166044803{margin-top: 100px !important;margin-bottom: 100px !important;}”][vc_custom_heading text=”Plan. Predict. Perfect” font_container=”tag:h2|text_align:center|color:%23ffffff” use_theme_fonts=”yes” css_animation=”fadeIn”][/vc_column][/vc_row]


