[vc_row][vc_column][vc_column_text]
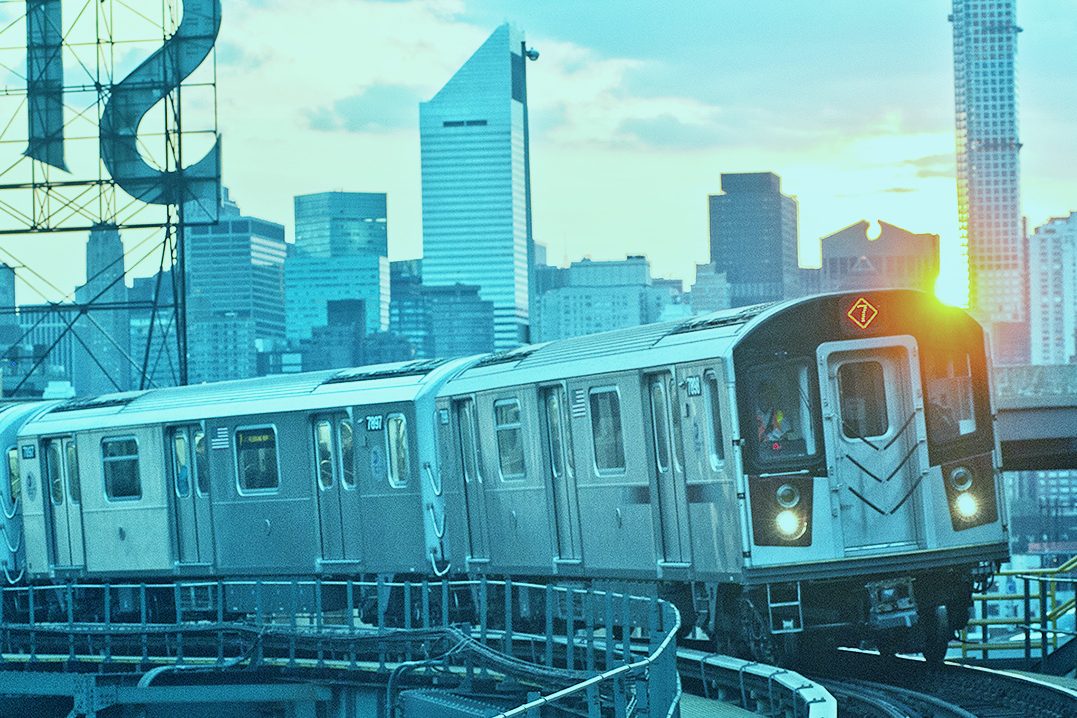
Rail Gets Commuter Safety on Track with Multimodal Insights
[/vc_column_text][vc_single_image image=”6800″ img_size=”full”][/vc_column][/vc_row][vc_row full_width=”stretch_row” bg_type=”image” parallax_style=”vcpb-default” css=”.vc_custom_1567163833988{background-position: center !important;background-repeat: no-repeat !important;background-size: cover !important;}”][vc_column width=”2/3″][vc_column_text]
By Christian Carstens, PR & Digital Marketing Manager
[/vc_column_text][vc_separator][vc_column_text]
Traveller safety – the top priority
Over the last two decades, safety has been under scrutiny. From terrorism threats to disease outbreaks, commuters have needed safeguarding – but it seems the goalposts are continuously shifting. Wherever the risk comes from, certain immutable factors need to be considered: crowd management, smooth traveller flow, and efficient resource management.
And then, there is the ever-more critical factor of commuter confidence. In a world where passengers have to place their lives and trust in transport decision-makers, commuters want to know that everything has been done to keep them safe, and these measures need to be visible to the traveller.
Understanding how people behave is vitally important in these circumstances. When operators have detailed insights into how and when travellers arrive, move, dwell and leave, they can more accurately predict show-up times and areas where crowding is likely to occur. This, in turn, allows for mitigating actions, like additional staff resources, redirecting passengers to less-busy areas, and even sharing travel information with commuters.
[/vc_column_text][vc_column_text]
Managing crowds
No crowd exists in isolation. They appear from nowhere. They are a function of movement. When we look closely at how crowds form and shift, we begin to understand that it is near-impossible to pinpoint any single cause. For example, several external factors could cause the capacity to exceed expectations. These could range from weather changes to delays at a different station or even something as unexpected as a protest action or a road traffic incident.
With such wild variations in causality, how can operators realistically hope to consistently manage the flow and minimise crowding? While it may feel like an overwhelming task, it all comes down to collecting, sorting and analysing a vast amount of data and using it both live and predictively.
[/vc_column_text][vc_column_text]
Supporting modal shifts
Disruptions can occur unexpectedly. At any given time, a train could be delayed or arrive early, leaving extra passengers on the platform. Employee disruptions and sanitation issues can cause plans to deviate from expectations. And, even if absolutely everything within one station runs smoothly and efficiently, an upset at any other point in the network can have a knock-on effect.
It is, therefore, essential to understand the entire rail network and to consider anything that affects passenger arrival and departure times, crowd management and safety when making resourcing or people-distribution plans. Only when operators have holistic insight into both past and current movement patterns can they begin to accurately and adequately plan their operations.
[/vc_column_text][vc_column_text]
Problem-solving data
By implementing a system that connects to and transforms any data source – including sensors, turnstiles, ticketing and actual train schedules – into actionable insight, operators can make the right decisions for their station, network and passenger safety.
Blending this input with historical data also proves useful in understanding the impacts of unexpected events on operations. As a result, operators can plan their resourcing more effectively while distributing and managing the flow of people more efficiently.
With a clear understanding of the impact of delays and external influences, operators can more easily predict the effects of external events and adjust plans to mitigate them effectively. They can offer increased service levels thanks to improved forecasting and resource planning. Space and safety are much easier to manage.
[/vc_column_text][vc_column_text]
Improving the passenger experience
One of the best ways travellers can feel safer is through real-time information-sharing and guidance. For example, operators can share live journey information – like entrance congestion, platform and carriage density levels, and which stations are least busy – using a combination of dynamic digital signage and mobile apps. Armed with this information, commuters can make more informed travel choices, like choosing a less-crowded platform or station or altering their travel time.
Not only does this provide travellers with more choice and control, but transit use also becomes better distributed, further minimising the risk of bottlenecks and ultimately improving the experience for all.
[/vc_column_text][vc_column_text]
Human behaviour is variable, which means operators need an ongoing flow of live, up-to-the-minute input, as well as sophisticated analysis and predictive functionality.
With end-to-end insights and improved operational visibility, operators can take control and make timely, proactive decisions, consistently and accurately matching the demand for a seamless, safe and stress-free journey.
[/vc_column_text][vc_separator][vc_column_text]Veovo helps transport hubs globally adapt to new processes and changing travel patterns, unlock efficient ways of working and provide safer journeys. Please get in touch to arrange a call with one of our experts to explore how we can help your business.[/vc_column_text][/vc_column][vc_column width=”1/12″][/vc_column][vc_column width=”1/4″][vc_row_inner gap=”5″ css=”.vc_custom_1590581603841{padding-right: 15px !important;padding-bottom: 30px !important;padding-left: 15px !important;}”][vc_column_inner css=”.vc_custom_1568208991171{margin: 0px !important;border-width: 0px !important;padding: 0px !important;}”][vc_single_image image=”8164″ img_size=”full” alignment=”center” css_animation=”top-to-bottom” el_id=”open-newsletter-popup”][/vc_column_inner][/vc_row_inner]
[vc_widget_sidebar show_bg=”false” sidebar_id=”sidebar_1″][/vc_column][/vc_row][vc_row full_width=”stretch_row” bg_type=”bg_color” bg_override=”full” seperator_enable=”seperator_enable_value” seperator_type=”tilt_right_seperator” seperator_svg_height=”220″ seperator_shape_background=”#ffffff” bg_color_value=”rgba(42,210,201,0.05)” css=”.vc_custom_1625573714432{margin-top: 50px !important;}”][vc_column][dt_testimonials_carousel dis_posts_total=”10″ content_layout=”layout_1″ content_alignment=”center” content_bg=”n” post_content_paddings=”30px 50px 20px 50px” img_max_width=”120px” img_border_radius=”500px” slides_on_wide_desk=”1″ slides_on_desk=”1″ autoplay=”y” post_title_font_size=”40px” post_title_line_height=”32px” post_title_bottom_margin=”5px” testimonial_position_font_size=”24px” testimonial_position_line_height=”28px” testimonial_position_color=”#2ad2c9″ post_content=”show_content” content_font_size=”17px” content_line_height=”27px” custom_content_color=”#253746″ content_bottom_margin=”0px” arrow_bg_width=”36x” arrow_border_width=”0px” arrow_bg_color=”#2ad2c9″ arrow_bg_color_hover=”#2fa8a1″ r_arrow_icon_paddings=”0px 0px 0px 0px” r_arrow_v_offset=”0px” l_arrow_icon_paddings=”0px 0px 0px 0px” l_arrow_v_offset=”0px” category=”9″ css_dt_testimonials_carousel=”.vc_custom_1605782394975{margin-top: 0px !important;background-position: center !important;background-repeat: no-repeat !important;background-size: contain !important;}”][/vc_column][/vc_row][vc_row full_width=”stretch_row” css=”.vc_custom_1625573726197{margin-bottom: -100px !important;background-color: #2ad2c9 !important;}”][vc_column css=”.vc_custom_1625573735894{margin-top: 50px !important;margin-bottom: 50px !important;}”][vc_custom_heading text=”Plan. Predict. Perfect” font_container=”tag:h1|text_align:center|color:%23ffffff” use_theme_fonts=”yes” css_animation=”fadeIn”][/vc_column][/vc_row]