[vc_row][vc_column][vc_column_text]
Closing the PX Gap: From Dots to Big Picture Insight
[/vc_column_text][vc_single_image image=”6929″ img_size=”full”][/vc_column][/vc_row][vc_row full_width=”stretch_row” bg_type=”image” parallax_style=”vcpb-default” css=”.vc_custom_1567163833988{background-position: center !important;background-repeat: no-repeat !important;background-size: cover !important;}”][vc_column width=”2/3″][vc_column_text]
By Siobhan Boyle, Marketing Manager
[/vc_column_text][vc_column_text]
Understanding passenger flow throughout the airport terminal forms the basis for many operational decisions. Most airports are not equipped to do this. Measuring queues is only part of the story.
It’s time airports also considered the entire Kerb-to-Flight journey, to close the gap between how airports see passengers today and their true airport experience.
[/vc_column_text][vc_separator][vc_column_text]
Most travellers are unaware that their behaviour (whether they like to shop, get to the airport early, wait for their flight at the gate or in a restaurant) has a significant impact on operations and profitability. For the airport, however, understanding how people move and dwell is key to transforming travel experiences and boosting efficiency. This is more critical now than ever before.
In and between spaces
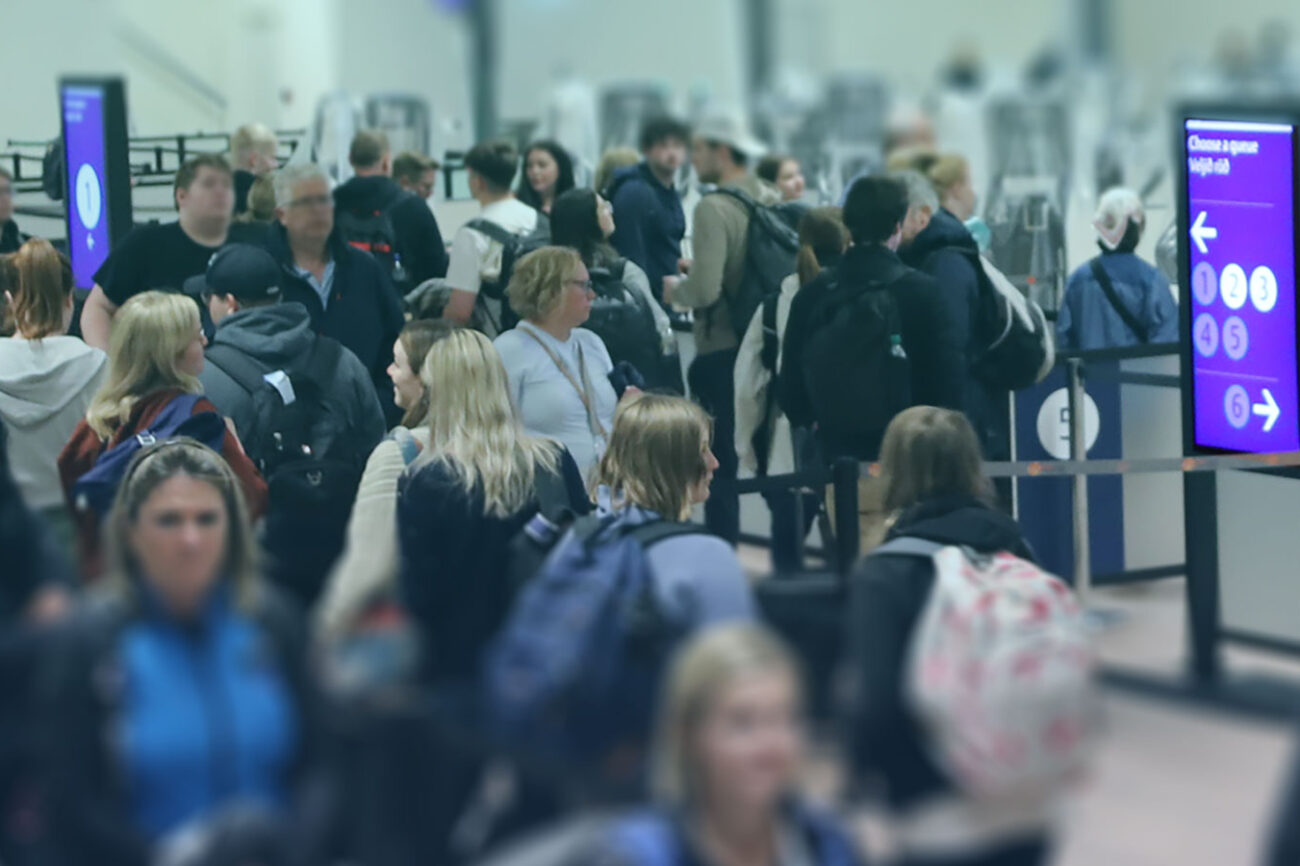
Today, many airports rely on cameras and related dots on a screen to visualise passenger movement and queue habits. These dots can show bottlenecks, crowding and wait times with great precision but typically only in a specific process or area. Also, cameras alone have certain limitations – they cannot see around corners, nor measure seamlessly how people move across the airport.
But why is it so crucial for operators to know how passengers move between areas and processes? Because seeing people as dots moving in a single location is very different from how travellers see their journey around the airport. It creates what’s known as the Passenger eXperience (PX) gap – the difference between what airports see and the actual travel experience.
As we rethink the new travel future, it’s time to stop viewing queues and processes in insolation. Measuring and reacting to a single bottleneck does not explain why it is happening, or the consequences of those decisions on the entire airport experience. Instead, the real questions operators need to answer are how guests move through the airport and what preferences they have on that journey.
It is only by measuring each traveller’s behaviour and linking it to a destination, based on their departure gate, that airports can gain a truly holistic view of the airport experience, and close the PX gap.
[/vc_column_text][vc_separator][vc_column_text]
It is only by measuring each traveller’s behaviour and linking it to a destination based on their departure gate, that airports can gain a truly holistic view of the true airport experience, and close the PX gap.
[/vc_column_text][vc_separator][vc_column_text]
Kerb-to-flight insight
The path to achieving better PX and performance outcomes is not just about measuring flow between zones. More specifically, it’s about measuring categories of passengers as they move throughout the terminal.
Analysing movement behaviours – filtering by segment, flight, time of day, class of travel and destination – can produce some exciting and unexpected data, which several airports are harnessing to their advantage.
At one large Europe hub, they found that a large percentage of passengers passing through one of the security processes were bypassing the centralised duty-free shopping area. They were then able to adjust the flow to increase retail exposure and spend.
Another major airport discovered that travellers on some flights would typically arrive at the gate sixty minutes before boarding, spending little time in concessions. As a result, the airport extended food and beverage services at specific gate piers.
One US airport used kerb-to-flight insight differently. With the ability to anonymously link guests to the wider multi-modal transport and the road traffic environment, they could tell what form of transport people were using to get to the airport – taxi, transit or car – and segment it by flight and service class (economy, business or first).
[/vc_column_text][vc_column_text]
Grasping the future
One of the most significant benefits in understanding how people have behaved in the past is predicting how people will behave in the future.
Yes, airports already use show-up and occupancy forecasts to create staffing rosters or lane opening plans. However, these tend to rely on historical aggregated data – such as how many people were in a line this time last week, or last month. But, in our currently volatile world, operational planning based on previous year’s, let alone last month´s approach, won’t help to flex to today’s challenges – or those of tomorrow.
Naturally, this data cannot offer the same granularity of insight compared to a per-flight forecast, like knowing the composition of each line or how transit passengers’ behaviour is different. Boarding pass scan data can offer some historical insight but tends to only provide timestamps at one or two processing points. Predicting behaviour around lounges, concessions and piers is almost impossible, as is gaining any insight into the movement patterns of arriving travellers.
By building a forecast using both per-flight and behavioural profiles, then continuously re-evaluating those profiles based on the live situation, operators can answer questions like:
- What is the impact of changes to the flight load on my security show-up profile?
- Is my occupancy threshold likely to be affected by an upstream process, such as a faster-than-predicted check-in process?
- What is the impact of early arrival or a gate change on immigration?
[/vc_column_text][vc_column_text]
Real data, smarter decisions
With a forecast that is regularly updated to reflect the situation, airports can make much smarter, more dynamic resourcing decisions.
Take baggage carousel allocations as an example. By basing actions off real passenger behaviour and the live schedule, airports can line up when the bags arrive on the belt with when people are likely to be there, rather than using some form of fixed priority.
By forecasting kiosk and counter check-in usage by flight, airports can create a more demand-driven check-in allocation for airline customers, lowering costs and improving the experience for all.
Rather than having idle staff handling empty security or border control lanes, capacity plans can be updated to stay closer to target wait time KPIs and save thousands of dollars a day. Airports can alter call-to-gate times to proactively prevent pier crowding, or adjust the pressure on restrooms. Concessionaires can alter shift breaks for retail staff to match demand.
Some innovative airports are now looking at how they influence the sequence of passengers arriving to pinch points, in a way that improves flow while using the same resources. For example, they may decide to allocate a stand for a flight that’s further away from baggage claim, to alter the timing of arrivals at immigration. Or, time the exact moment when doors are opened on an aircraft.
With airport-wide passenger flow management that maps real movement and not just dots per process or area, operators can now truly walk in their customers’ shoes from arrival to departure. What insights are uncovered along the way can only lead to better, smoother experiences for travellers in the years to come.
[/vc_column_text][vc_separator][vc_column_text]Veovo helps airports globally adapt to new processes and changing travel patterns, unlock efficient ways of working and provide safer journeys. Please get in touch to arrange a call with one of our experts to explore how we can help your business.[/vc_column_text][/vc_column][vc_column width=”1/12″][/vc_column][vc_column width=”1/4″][vc_single_image image=”8164″ img_size=”full” alignment=”center” css_animation=”top-to-bottom” el_id=”open-newsletter-popup”]
[vc_widget_sidebar show_bg=”false” sidebar_id=”sidebar_1″][/vc_column][/vc_row][vc_row full_width=”stretch_row” bg_type=”bg_color” bg_override=”full” seperator_enable=”seperator_enable_value” seperator_type=”tilt_right_seperator” seperator_svg_height=”220″ seperator_shape_background=”#ffffff” bg_color_value=”rgba(42,210,201,0.05)” css=”.vc_custom_1625573568043{margin-top: 50px !important;}”][vc_column][dt_testimonials_carousel dis_posts_total=”10″ content_layout=”layout_1″ content_alignment=”center” content_bg=”n” post_content_paddings=”30px 50px 20px 50px” img_max_width=”120px” img_border_radius=”500px” slides_on_wide_desk=”1″ slides_on_desk=”1″ autoplay=”y” post_title_font_size=”40px” post_title_line_height=”32px” post_title_bottom_margin=”5px” testimonial_position_font_size=”24px” testimonial_position_line_height=”28px” testimonial_position_color=”#2ad2c9″ post_content=”show_content” content_font_size=”17px” content_line_height=”27px” custom_content_color=”#253746″ content_bottom_margin=”0px” arrow_bg_width=”36x” arrow_border_width=”0px” arrow_bg_color=”#2ad2c9″ arrow_bg_color_hover=”#2fa8a1″ r_arrow_icon_paddings=”0px 0px 0px 0px” r_arrow_v_offset=”0px” l_arrow_icon_paddings=”0px 0px 0px 0px” l_arrow_v_offset=”0px” category=”10″ css_dt_testimonials_carousel=”.vc_custom_1599546519532{margin-top: 0px !important;background-position: center !important;background-repeat: no-repeat !important;background-size: contain !important;}”][/vc_column][/vc_row][vc_row full_width=”stretch_row” css=”.vc_custom_1625573582180{margin-bottom: -100px !important;background-color: #2ad2c9 !important;}”][vc_column css=”.vc_custom_1625573611242{margin-top: 50px !important;margin-bottom: 50px !important;}”][vc_custom_heading text=”Plan. Predict. Perfect” font_container=”tag:h1|text_align:center|color:%23ffffff” use_theme_fonts=”yes” css_animation=”fadeIn”][/vc_column][/vc_row]


