[vc_row][vc_column][vc_column_text]
Smoothing passenger flow and the airport departure experience
[/vc_column_text][vc_single_image image=”5168″ img_size=”full” alignment=”center”][/vc_column][/vc_row][vc_row full_width=”stretch_row” bg_type=”image” parallax_style=”vcpb-default” css=”.vc_custom_1567163833988{background-position: center !important;background-repeat: no-repeat !important;background-size: cover !important;}”][vc_column width=”2/3″][vc_column_text]
By Siobhan Boyle, Product Marketing
[/vc_column_text][vc_separator][vc_column_text]From the moment a passenger journeys to the departure terminal, they face a series of small but potentially stressful challenges.
Find parking. Find a baggage cart. Find the correct departure terminal. Find the check-in desk. All the while wondering if they will make it to the departure gate on time. Each step in this journey through the airport leaves an impression on the passenger – good, not so good, or downright frustrating.
A traveller’s overall satisfaction with all touchpoints directly impacts every airport’s bottom line, which is why many now seek to measure it.
The leading method is the Airport Service Quality (ASQ) global benchmarking program, used by three-quarters of the world’s top 1000 busiest airports. The program measures passenger satisfaction by asking travellers to rate their experience during the journey, from departure and transfer to arrival. Then, it compares the results with other airports.
From wait times to parking and shopping facilities, the departure process measured by ASQ can make or break a passenger’s airport experience and strongly influence their future choice of airport.
With ASQ departure surveys capturing data after a specific process, for instance, check-in, security, retail or amenities, it’s tempting for airports to turn their attention to the worst-performing area – such as poorly performing security queues – and leave the rest. But many airports find that tackling one pinch point often pushes the problem along to the next.
This is leading more airports to move beyond queue management to a more holistic, end-to-end flow management approach to lift passenger experiences. According to SITA’s 2019 Air Transport IT Insights Report, most (63%) airports that have invested in passenger flow management have witnessed an improvement of up to 20% in passenger satisfaction ratings compared to the previous year.[/vc_column_text][vc_column_text]
What is passenger flow management?
Flow management is more than just capturing data, although that’s part of it. As people move across the airport, it combines WiFi/Bluetooth and 3D sensors, boarding pass scans and other third-party data to build a real-time picture of how people move and dwell. The real benefit is the analysis of that data, which, when meshed with flight data, provides powerful insights – including the ability to identify bottlenecks, forecast the impact of unexpected changes on flow and recommend the best actions to smooth throughput.
Airports often ask how flow management can help their ASQ scores. It is about looking at each measured process and piecing it all together so that issues don’t shift from one process to another.
Let’s look at some of the ASQ-measured processes and see how flow management can make a difference.[/vc_column_text][vc_column_text]
1. Ground transportation/ parking
Before a passenger sets off from their home or hotel, can they predict how smooth their journey from their door-to-departure gate will be? Not usually.
But with a holistic flow management system, they can. It can take account of traffic jams on the roads leading to the airport, pick-up delays in public transportation and connect to parking systems to let passengers know how many unoccupied spaces are left. Auckland Airport, for instance, uses flow management to manage traffic minute-by-minute around the airport. They have also launched a home-to-gate journey planner on its app, advising on drive times, parking, predicted screening and processing times in one application.[/vc_column_text][vc_column_text]
2. Trolley availability
Luggage trolleys tend to be left in different spots throughout the terminal, parking and surrounding areas. Not so handy during those busy peak periods.
Using asset flow management and BLE tags on each trolley, airports can determine precisely where trolleys are located and how passengers use and discard them. Then, by combining trolley flow data with flight profile information, airports can predict the number of trolleys needed to match both departing and arriving passengers.[/vc_column_text][vc_column_text]
3. Check-in
Airports that analyse crowd and queue formations and check-in processing can handle congestion and safety issues much faster than those that can’t.
Fixed counter timeframes can cause a significant decrease in capacity and cost the airport in lost retail dwell time. By layering show-up forecasts by flight with check-in preferences and real-time transportation data, airports can dynamically predict resource demand and adjust desk allocation and ensure a seamless check-in process.[/vc_column_text][vc_column_text]
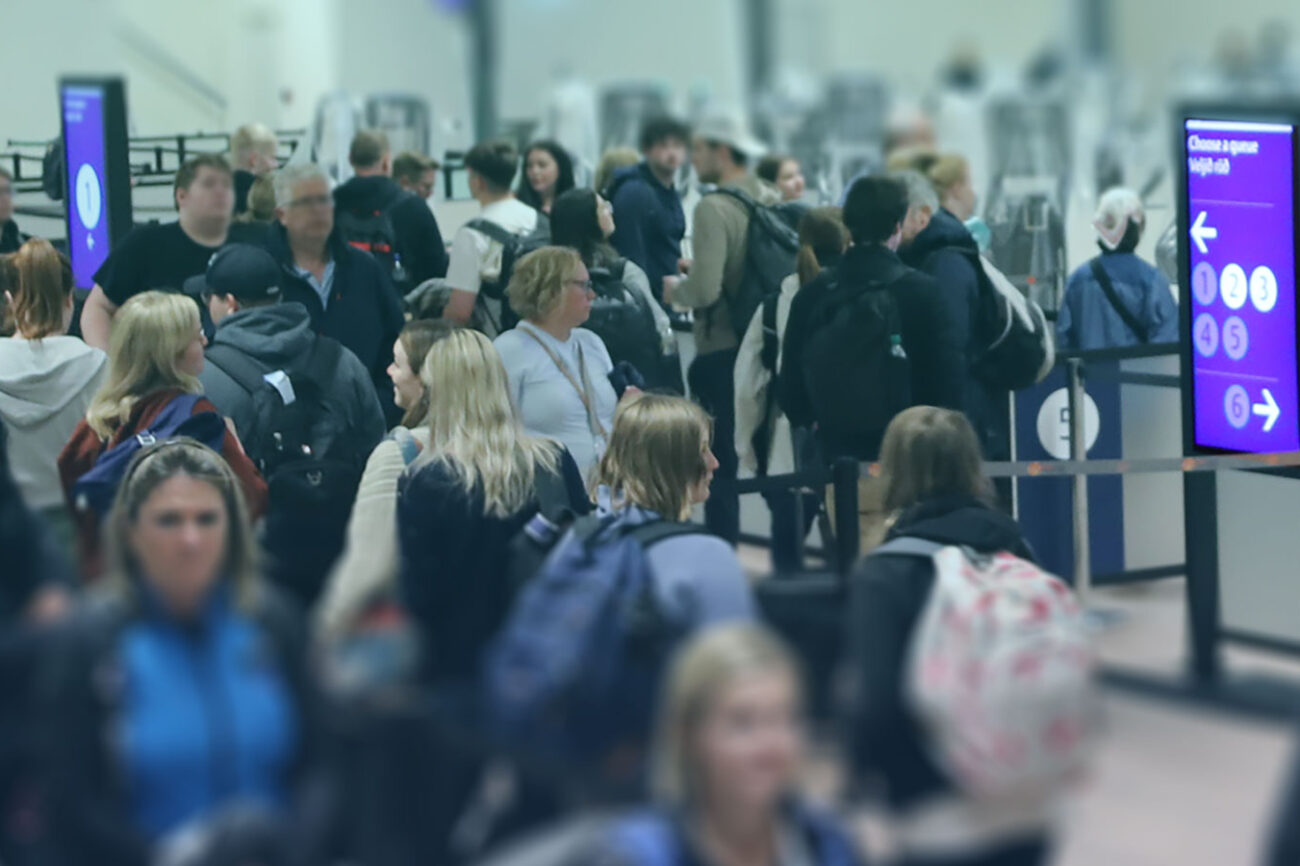
4. Passport and Security
While communicating wait times is commonly used to manage expectations and reduce stress, airports that use historical data to predict show-up profiles for capacity planning can improve throughput and reduce the time spent in queues.
This more predictive approach to crowd management also allows passengers to plan their journeys better. For instance, a day before departure, a traveller can receive a notification on their travel app of the likely journey/queue time and a recommended airport arrival time.[/vc_column_text][vc_column_text]
5. Facilities and comfort
With passenger behaviour analytics, it’s easier to see where people move, what gets used, and when – allowing airports to shape short-term actions and long-term planning decisions.
From restroom cleaning and gate crowding, using passenger flow data connected with information displays can direct customers to alternative facilities or hold them in the concession areas longer if piers are at risk of overcrowding.[/vc_column_text][vc_separator][vc_column_text]
Know what influences flow and deliver a fantastic service faster
To make the shift to flow management technology, airports can start by augmenting existing sensor queue management and biometric technology with strategically placed Bluetooth and wi-fi sensors. This will help build a more granular picture of flow and allow airports to take actions based on that insight.
From this step, airports can then truly boost their understanding of how people crowd and flow by connecting traffic, flight and baggage flow insight. From here, flow management technology platforms can model patterns, automatically predict issues and make recommendations to perfect their response.[/vc_column_text][vc_widget_sidebar show_bg=”false” sidebar_id=”sidebar_1″][vc_separator][vc_column_text]
Want to know more? Contact our experts HERE!
[/vc_column_text][/vc_column][vc_column width=”1/12″][/vc_column][vc_column width=”1/4″][vc_row_inner gap=”5″ css=”.vc_custom_1568209076572{padding-right: 15px !important;padding-left: 15px !important;}”][vc_column_inner css=”.vc_custom_1568208991171{margin: 0px !important;border-width: 0px !important;padding: 0px !important;}”][vc_single_image image=”8164″ img_size=”full” alignment=”center” css_animation=”top-to-bottom” el_id=”open-newsletter-popup”][/vc_column_inner][/vc_row_inner]
[/vc_column][/vc_row][vc_row full_width=”stretch_row” bg_type=”bg_color” bg_override=”full” seperator_enable=”seperator_enable_value” seperator_type=”tilt_right_seperator” seperator_svg_height=”220″ seperator_shape_background=”#ffffff” bg_color_value=”rgba(42,210,201,0.05)” css=”.vc_custom_1625643445959{margin-top: 50px !important;}”][vc_column][dt_testimonials_carousel dis_posts_total=”10″ content_layout=”layout_1″ content_alignment=”center” content_bg=”n” post_content_paddings=”30px 50px 20px 50px” img_max_width=”120px” img_border_radius=”500px” slides_on_wide_desk=”1″ slides_on_desk=”1″ autoplay=”y” post_title_font_size=”40px” post_title_line_height=”32px” post_title_bottom_margin=”5px” testimonial_position_font_size=”24px” testimonial_position_line_height=”28px” testimonial_position_color=”#2ad2c9″ post_content=”show_content” content_font_size=”17px” content_line_height=”27px” custom_content_color=”#253746″ content_bottom_margin=”0px” arrow_bg_width=”36x” arrow_border_width=”0px” arrow_bg_color=”#2ad2c9″ arrow_bg_color_hover=”#2fa8a1″ r_arrow_icon_paddings=”0px 0px 0px 0px” r_arrow_v_offset=”0px” l_arrow_icon_paddings=”0px 0px 0px 0px” l_arrow_v_offset=”0px” category=”10″ css_dt_testimonials_carousel=”.vc_custom_1563263131577{margin-top: 0px !important;background-position: center !important;background-repeat: no-repeat !important;background-size: contain !important;}”][/vc_column][/vc_row][vc_row full_width=”stretch_row” css=”.vc_custom_1625643426244{margin-bottom: -100px !important;background-color: #2ad2c9 !important;}”][vc_column css=”.vc_custom_1625643458486{margin-top: 50px !important;margin-bottom: 50px !important;}”][vc_custom_heading text=”Plan. Predict. Perfect” font_container=”tag:h1|text_align:center|color:%23ffffff” use_theme_fonts=”yes” css_animation=”fadeIn”][/vc_column][/vc_row]


