[vc_row][vc_column][vc_column_text]
Standing in Line a Nightmare?
Here’s How Airports Fix That!
[/vc_column_text][vc_single_image image=”4000″ img_size=”full” alignment=”center”][/vc_column][/vc_row][vc_row full_width=”stretch_row” bg_type=”image” parallax_style=”vcpb-default” css=”.vc_custom_1567163833988{background-position: center !important;background-repeat: no-repeat !important;background-size: cover !important;}”][vc_column width=”2/3″][vc_column_text]
By Christian Carstens
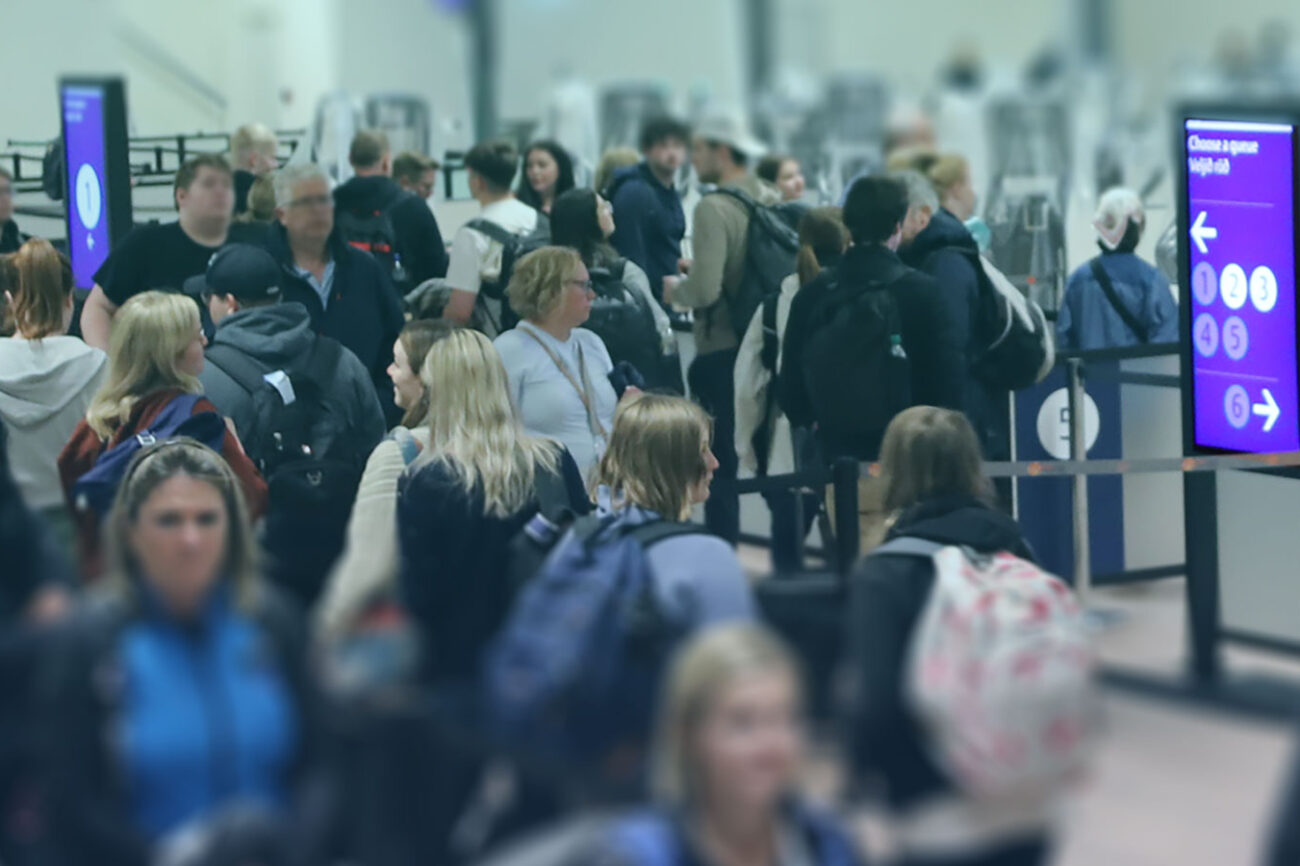
Nobody likes to wait in line, yet it is completely unavoidable in some places – like the airport. But what if there were a way to make those inevitable queues move faster and keep the experience more pleasant for those in line? It all comes down to understanding why queuing is so painful and doing something about it.
[/vc_column_text][vc_separator][vc_column_text]
The torture of waiting
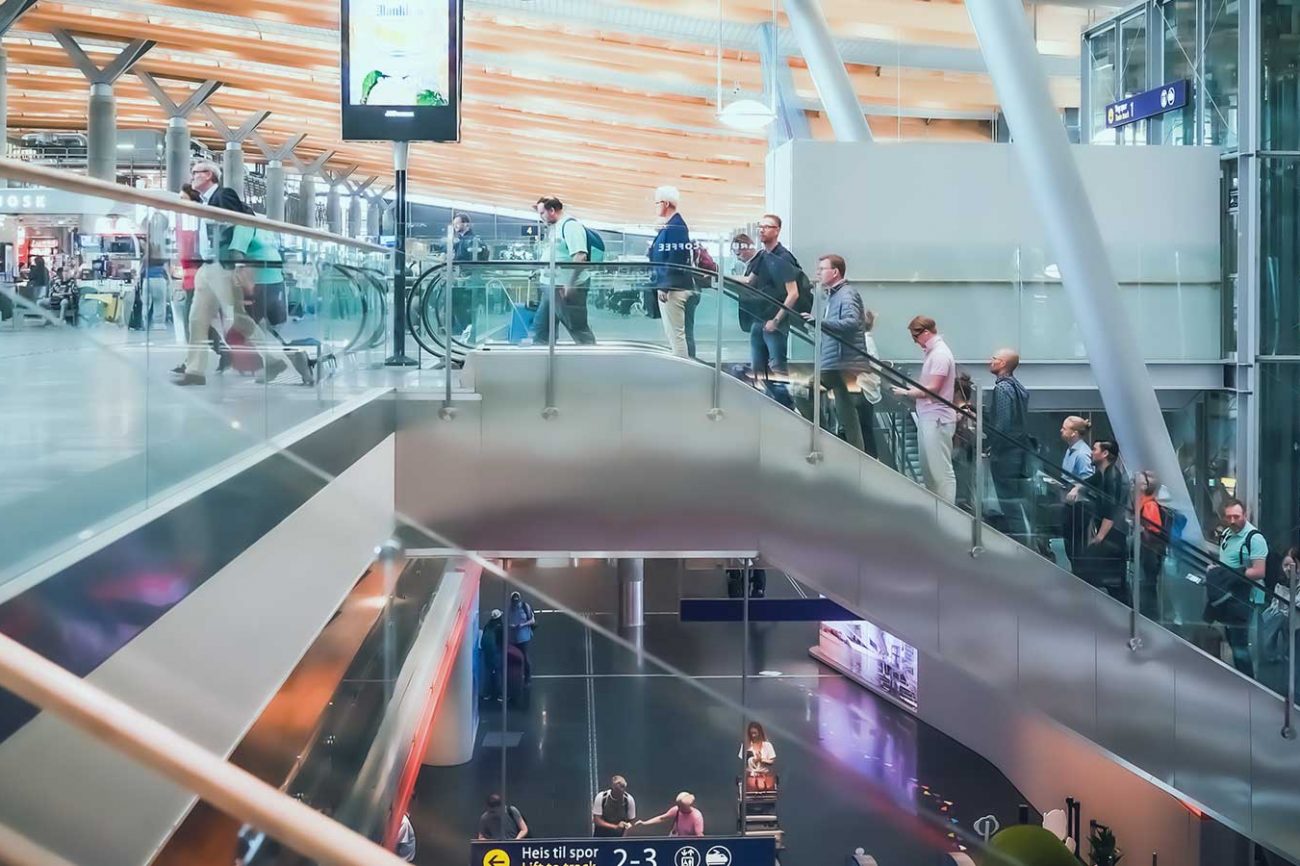
Over the last twenty years, the airport environment has grown much more pressurised. With more security checks worldwide following 9/11, growth in passenger and flight numbers each year, and limited space to expand existing infrastructure, modern airports frequently have to contend with long lines of tired, frustrated people.
This puts increasing pressure on management to ensure staff are correctly deployed, gauge the flow and number of people through processes, and deal with unforeseen events, like delays, traffic congestion or severe weather conditions. Just one delayed or late-arriving flight can cause all planning to go awry.
Most international airports have implemented automation to help reduce lines, including self-check-in options and self-service bag drops, but that doesn’t eliminate the need to stand in line. If everything runs smoothly and at top efficiency, things will move reasonably quickly, but when things go wrong, it’s a recipe for extremely agitated passengers.
It’s simple: standing in line with no clear understanding of what’s going on can make travellers frustrated, angry and stressed, and for good reasons.
Plenty of research has been conducted on the psychology of lines, and much of that research agrees: most queue-based frustration is caused by a combination of boredom and a lack of information.
In the case of boredom, having nothing to occupy your mind can make the duration feel much longer than it is. People have been shown to overestimate the length of time spent in line by around 36 per cent, meaning that boredom changes how they perceive time.
As for lack of accurate information, their frustration immediately increases when people don’t know how long they can be expected to queue. They resort to guessing and hoping things will move quickly enough while caught in a web of uncertainty.
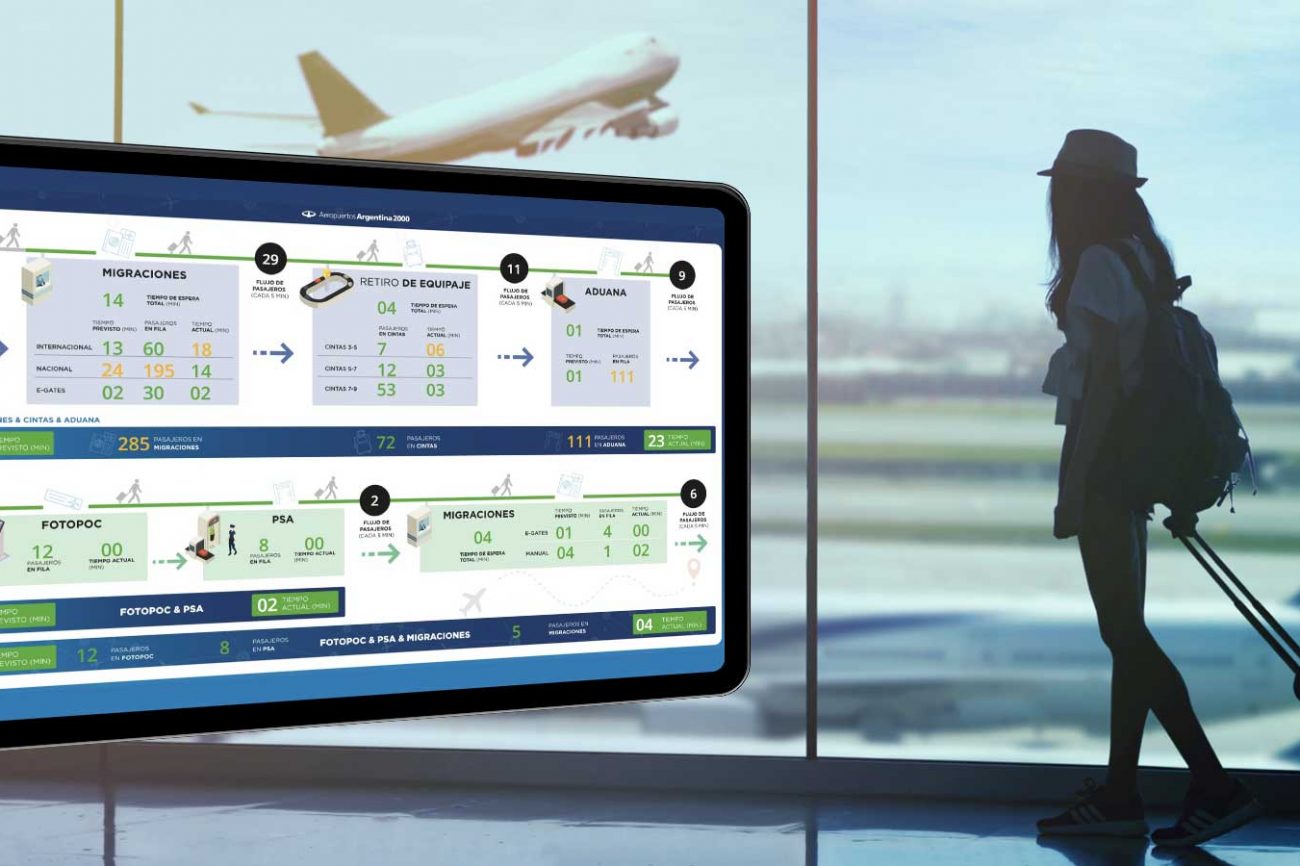
 Fortunately, the research has shown that providing accurate information helps travellers feel more in control, thanks to clear expectations. Highlighting just how crucial it is, the 2019 Airport Delight Report found that as many as 77 per cent of passengers want wait time data.
One of the major stumbling blocks to providing accurate wait-time information is gathering and processing relevant information.
Airports are working reactively by relying on human monitoring to accurately gauge where bottlenecks could happen or where staff are needed to help speed things up. Bottlenecks are only dealt with once they are already a problem rather than before they occur.
Passenger Predictability, however, is taking the guesswork out of airport operations.
[/vc_column_text][vc_separator][vc_column_text]
From queue time to flow insight
Traditionally, airports have tackled the need for process information by focusing on a single area, implementing technology to measure wait time where bottlenecks and other hold-ups are most frequent.
While this approach is certainly helpful, it has its limitations. Tackling one pinch point only can lead to a build-up of congestion elsewhere. To optimise and improve individual areas of operations, it is essential to understand how all areas and processes interconnect and influence each other. With an airport-wide understanding of how people move and dwell, it is easier to focus on the right challenges and improve all processes.
Several technologies are available to help both deliver queue and flow insights and improve capacity planning to reduce queues — These range from WiFi/BLE sensors to camera-based solutions. The question is: which technology is the most effective?
3D sensor solutions provide an unparalleled level of accuracy for people-counting and dwell-time statistics, offering a detailed picture of queues per processing point. However, they are not best suited to measuring how people move through multiple processes, as they struggle with gaps in coverage and are easily influenced by changing environmental conditions like lighting and physical obstacles.
Meanwhile, WiFi/BLE sensor solutions are ideal for measuring passenger queues and flow, both individually and through multiple processing points. They are, however, less than ideal for people counting.[/vc_column_text][vc_separator][vc_column_text]
Making the right choice
While each technology has its unique benefits, no one technology alone can meet all needs, and technology designed for a particular area may not work correctly for another.
A better solution is to combine them. IoT systems that apply data gathered from multiple sensor types to unified analytics software are the most effective in minimising congestion and smoothing passenger throughput. These hybrid solutions effectively eliminate blind spots around the terminal, and if queue times exceed a defined threshold, teams can be alerted immediately. More importantly, combining multi-sensor monitoring with historical data allows for forecast generation, enabling the prediction of bottlenecks before they occur.[/vc_column_text][vc_separator][vc_column_text]
Adopting the tech
In 2018, the Port Authority of New York and New Jersey (PANYNJ) adopted Veovo´s Passenger Predictability solution to manage lines and display wait times at TSA security checkpoints and taxi stands at JFK, Newark, LaGuardia and Stewart Airports. The goal was two-fold: first, to provide accurate information to manage passenger expectations; second, to enable the airports to develop strategies and to target resources to reduce wait times. [/vc_column_text][vc_row_inner css=”.vc_custom_1567680245337{margin-top: -100px !important;}”][vc_column_inner width=”1/4″][vc_single_image image=”3595″ alignment=”center” style=”vc_box_circle” el_id=”TestZ”][/vc_column_inner][vc_column_inner width=”3/4″][vc_column_text]
“With real-time data posted on each of the airports’ websites and screens at the terminals, wait times are readily available to help reduce passenger stress and enable travellers to plan based on the queue times they will encounter. Moreover, the information makes it easier for staff to monitor checkpoint wait times and call for additional resources to congested areas,” says Rick Cotton, Executive Director at Port Authority
[/vc_column_text][/vc_column_inner][/vc_row_inner][vc_separator][vc_column_text]A couple of years earlier, Cincinnati/Northern Kentucky International Airport (CVG) had turned to the same solution to help reduce frustration and complaints resulting from people’s inaccurate perception of time.
Not only has CVG reduced complaints, but it has also successfully used the collected data to recommend TSA staffing adjustments, resulting in a one-third reduction in processing times.
 [/vc_column_text][vc_row_inner css=”.vc_custom_1567680235391{margin-top: -100px !important;}”][vc_column_inner width=”1/4″][vc_single_image image=”2350″ alignment=”center” style=”vc_box_circle” el_id=”TestZ”][/vc_column_inner][vc_column_inner width=”3/4″][vc_column_text]
“Much of our interest in the public display of wait times was to dispel perception from reality. To paraphrase the old adage, ask five people what their actual wait time was, and you’ll get five different answers. Following deployment, complaints are now rare, as the passenger immediately understands the present situation and adapts,” says Brian Cobb, Vice President of Customer Experience at CVG
[/vc_column_text][/vc_column_inner][/vc_row_inner][vc_separator][vc_column_text]At Amsterdam Schiphol, the solution isn’t simply used for displaying wait times in processing points. It also plays a significant part in the airport’s digital transformation, as it will soon deliver airport-wide passenger movement analytics from entrance to flight.
 [/vc_column_text][vc_row_inner css=”.vc_custom_1567680226155{margin-top: -100px !important;}”][vc_column_inner width=”1/4″][vc_single_image image=”3998″ alignment=”center” style=”vc_box_circle” el_id=”TestZ”][/vc_column_inner][vc_column_inner width=”3/4″][vc_column_text]
“It helps us manage performance with data-driven certainty. With real-time visibility of passenger flow, we can keep pinch-point processing quick, but also make holistic decisions on how to create more efficient and more meaningful customer experiences throughout the airport,” says Michiel de Haas, Capacity Manager at Amsterdam Schiphol
[/vc_column_text][/vc_column_inner][/vc_row_inner][vc_separator][vc_column_text]Auckland Airport has taken the benefits of the technology a step further by collaborating with road authorities. This cooperation has given the airport even more detailed insights into potential congestion or other delays, both on the road and in the airport. As a result, besides wait times at pinch points, travellers also receive travel time information on the road.
Numerous other airports are following suit and have almost universally experienced a reduction in queue times, as well as complaints. They have recognised that informed travellers are happier and less stressed, leading to an improved travel experience.[/vc_column_text][vc_widget_sidebar show_bg=”false” sidebar_id=”sidebar_1″][/vc_column][vc_column width=”1/12″][/vc_column][vc_column width=”1/4″][vc_widget_sidebar show_bg=”false” sidebar_id=”sidebar_1″][vc_row_inner gap=”5″ css=”.vc_custom_1568209359802{padding-right: 15px !important;padding-left: 15px !important;}”][vc_column_inner css=”.vc_custom_1568209326694{margin: 0px !important;border-width: 0px !important;padding: 0px !important;}”][vc_single_image image=”8164″ img_size=”full” alignment=”center” css_animation=”top-to-bottom” el_id=”open-newsletter-popup”][/vc_column_inner][/vc_row_inner]
[/vc_column][/vc_row][vc_row full_width=”stretch_row” bg_type=”bg_color” bg_override=”full” seperator_enable=”seperator_enable_value” seperator_type=”tilt_right_seperator” seperator_svg_height=”220″ seperator_shape_background=”#ffffff” bg_color_value=”rgba(42,210,201,0.05)” css=”.vc_custom_1519271452847{margin-top: 50px !important;padding-bottom: 100px !important;}”][vc_column][dt_testimonials_carousel dis_posts_total=”10″ content_layout=”layout_1″ content_alignment=”center” content_bg=”n” post_content_paddings=”30px 50px 20px 50px” img_max_width=”120px” img_border_radius=”500px” slides_on_wide_desk=”1″ slides_on_desk=”1″ autoplay=”y” post_title_font_size=”40px” post_title_line_height=”32px” post_title_bottom_margin=”5px” testimonial_position_font_size=”24px” testimonial_position_line_height=”28px” testimonial_position_color=”#2ad2c9″ post_content=”show_content” content_font_size=”17px” content_line_height=”27px” custom_content_color=”#253746″ content_bottom_margin=”0px” arrow_bg_width=”36x” arrow_border_width=”0px” arrow_bg_color=”#2ad2c9″ arrow_bg_color_hover=”#2fa8a1″ r_arrow_icon_paddings=”0px 0px 0px 0px” r_arrow_v_offset=”0px” l_arrow_icon_paddings=”0px 0px 0px 0px” l_arrow_v_offset=”0px” category=”10″ css_dt_testimonials_carousel=”.vc_custom_1563263131577{margin-top: 0px !important;background-position: center !important;background-repeat: no-repeat !important;background-size: contain !important;}”][/vc_column][/vc_row][vc_row full_width=”stretch_row” css=”.vc_custom_1567166018747{background-image: url(https://veovoforum.wpengine.com/wp-content/uploads/2018/12/veovo_homepage_background.jpg?id=2972) !important;}”][vc_column css=”.vc_custom_1567166044803{margin-top: 100px !important;margin-bottom: 100px !important;}”][vc_custom_heading text=”Plan. Predict. Perfect” font_container=”tag:h1|text_align:center|color:%23ffffff” use_theme_fonts=”yes” css_animation=”fadeIn”][/vc_column][/vc_row]
